How to Build Market Sizing Slides That Investors Actually Believe

Market sizing is often treated as a slide with a big number, but done poorly it can quickly undermine credibility. This article explains how to think about TAM, SAM, and SOM in a practical, defensible way, and how to turn them into clear market sizing slides that investors and decision-makers trust. You’ll learn how to calculate each metric, avoid common pitfalls, and present a market opportunity that reflects both ambition and realism.
A practical guide to TAM, SAM, and SOM
Market sizing is one of those topics that looks simple on the surface and gets people into trouble very quickly.
Almost every pitch deck, business case, or strategy presentation includes a market sizing slide. And almost every investor has seen dozens of versions that are either wildly inflated, poorly reasoned, or disconnected from reality.
The purpose of market sizing is not to show the biggest number possible. It’s to show that you understand:
the market you’re entering
where demand actually comes from
and what portion of it you can realistically capture
In this guide, I’ll walk through how to think about TAM, SAM, and SOM, how to calculate them in a defensible way, and how to turn the numbers into clear, credible slides.
👉 Rewrite suggestion (human): Add a short anecdote here about a bad TAM slide you’ve seen, built, or been challenged on. Specific pain points work very well here.
What TAM, SAM, and SOM actually mean
Market sizing is usually expressed using three related metrics, often shown as nested circles. While the visuals are familiar, the logic behind them is often misunderstood.
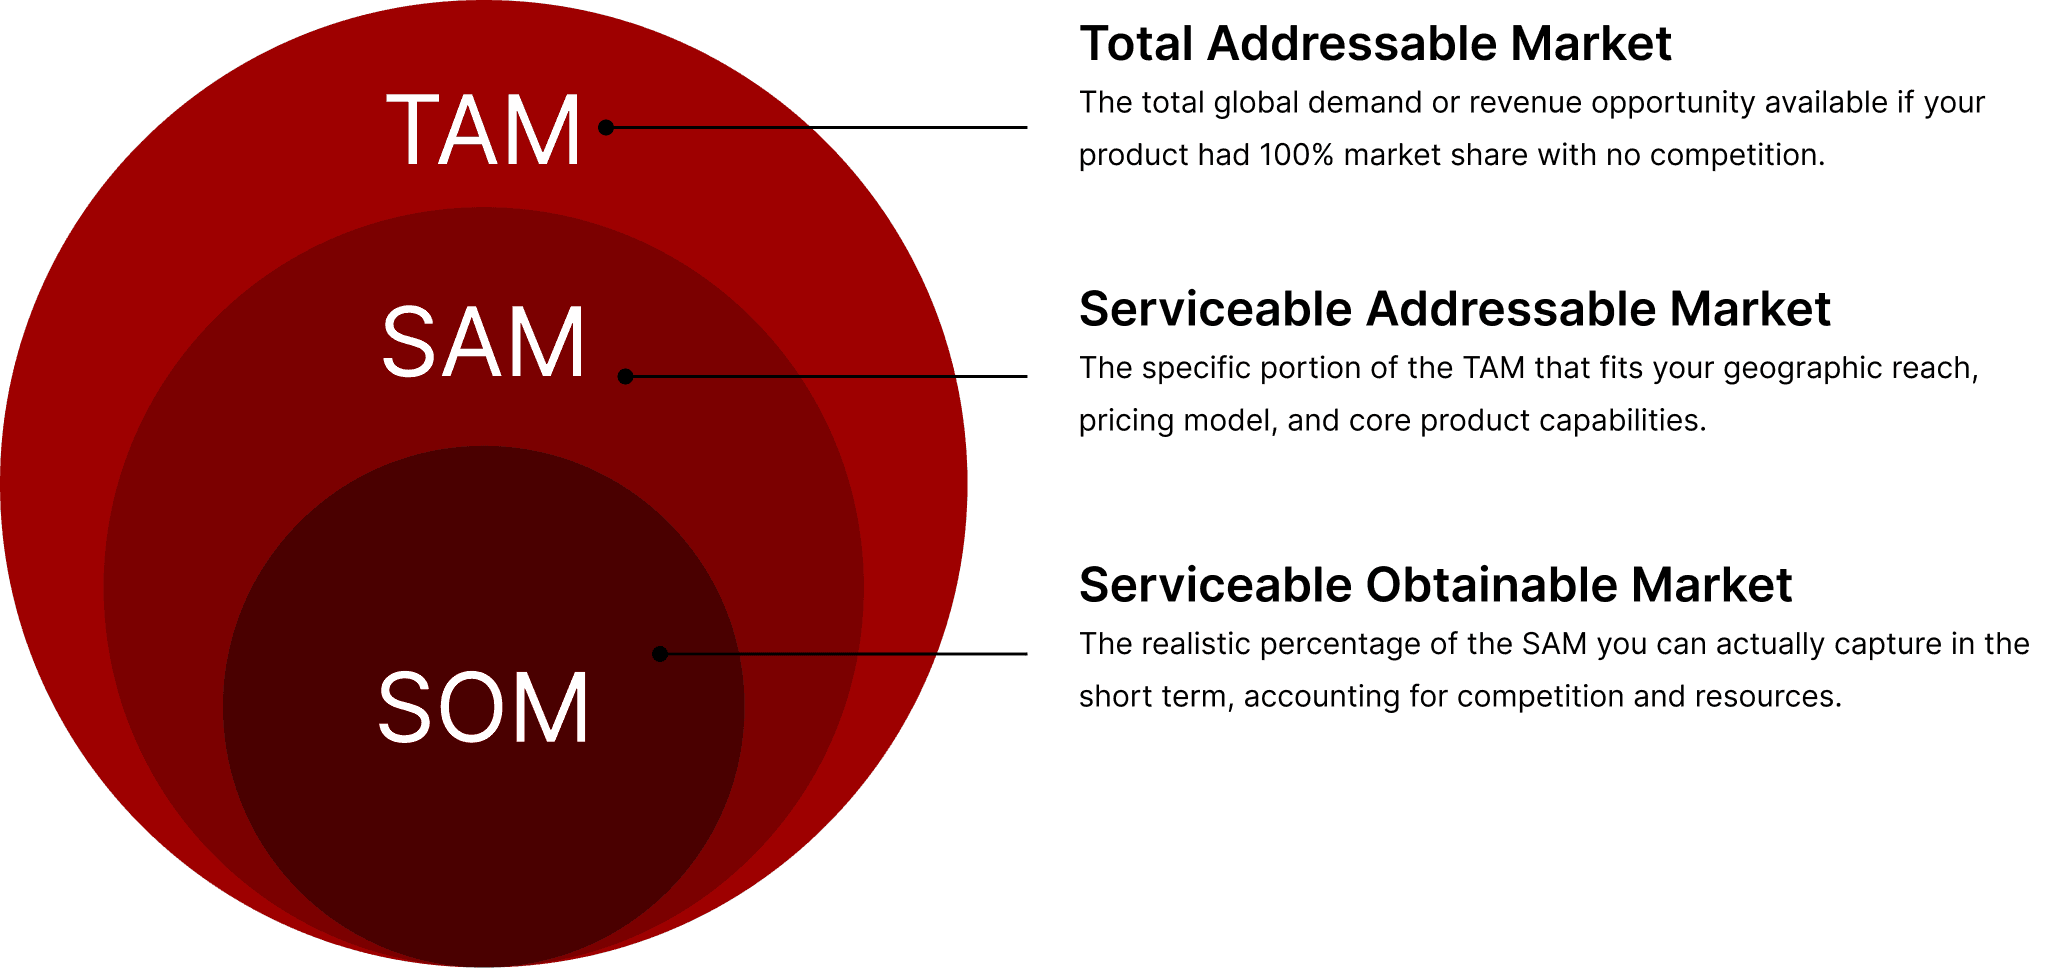
Total Addressable Market (TAM)
TAM represents the total demand for your type of product or service if you captured 100% of the market.
This is the theoretical upper bound. No competition. No constraints. Just “if everyone who could buy did buy”.
TAM helps answer one question:
Is this market big enough to be worth playing in?
Service Available Market (SAM)
SAM is the portion of the total market that your product can realistically serve based on:
geography
customer type
use case
business model
In other words, SAM is the part of the market you are actually targeting.
Service Obtainable Market (SOM)
SOM is the most grounded number of the three.
It represents the share of the serviceable market you believe you can capture in the near to medium term, given:
competitors
distribution constraints
resources
speed of execution
If TAM shows ambition and SAM shows focus, SOM shows realism.
Understanding TAM (and why it’s often abused)
TAM is meant to describe market potential, not market outcomes. The problem is that many teams treat TAM as a persuasion tool rather than an analytical one.
Used correctly, TAM helps frame opportunity. Used poorly, it raises red flags.
Two ways to calculate TAM
There are two standard methods. Both can be useful, but they don’t carry equal credibility.
Top-down TAM (fast, but fragile)
Top-down market sizing starts with an external number, usually from:
industry reports
analyst estimates
consulting or research firms
You take a large published figure and apply percentages to narrow it down.
Example:
“The global market is $50B. If we capture 2%, that’s a $1B opportunity.”
This approach is quick and sometimes useful as a sense check. But it has serious limitations:
categories may not match your product
assumptions are often vague
numbers are hard to defend under scrutiny
Top-down TAM should rarely stand alone.
Bottom-up TAM (preferred in most cases)
Bottom-up TAM starts from your actual customer and pricing logic.
The basic formula is simple:
TAM = number of potential customers × average revenue per customer
Example:
If you sell a B2B tool at $1,200 per year and there are 8,000 companies that fit your target profile, your TAM is ~$9.6M annually.
Bottom-up analysis forces clarity:
Who exactly is the customer?
What do they pay?
How many of them exist?
This is why investors and executives usually trust it more.
Moving from TAM to SAM: narrowing the focus
SAM is where market sizing becomes useful for planning.
Very few products are relevant to “everyone”. SAM forces you to be honest about who you are actually building for right now.
You reduce TAM into SAM by applying real-world filters such as:
geography (e.g. EU only)
company size
industry
maturity level
regulatory constraints
Example:
If your TAM includes all hospitals, but your product is only suitable for private hospitals in Europe, then only those belong in your SAM.
SAM is the market you are actively choosing to compete in.
Calculating SAM in practice
SAM is usually calculated by continuing your bottom-up logic and excluding customers that don’t fit your go-to-market reality.
Using the same structure as TAM:
SAM = relevant customer subset × average revenue per customer
The goal is not precision. The goal is credibility and internal consistency.
SAM should feel:
smaller than TAM
more concrete
directly connected to your strategy
If your SAM still feels abstract, it’s probably too broad.
SOM: defining what you can realistically win
SOM is where ambition meets constraints.
This number answers a very practical question:
What share of this market could we plausibly capture?
If you already have revenue
SOM can be calculated as your current share of SAM.
Example:
If your SAM is $20M and your revenue in that segment is $3M, your SOM is 15%.
You can then project SOM forward based on:
growth plans
competitive dynamics
capacity constraints
If you’re pre-revenue
SOM is a projection, but it should still be reasoned.
Typical approaches include:
capturing X% of SAM within Y years
benchmarking against similar companies at the same stage
mapping customer acquisition capacity
Be ambitious, but grounded. SOM that feels disconnected from reality undermines the entire slide.
Common market sizing mistakes (and how to avoid them)
Based on experience reviewing and building dozens of these slides, a few pitfalls show up repeatedly.
1) Inflating TAM to look impressive
Big numbers without logic invite skepticism. A smaller, well-defended market is often more attractive than a massive, vague one.
2) Mixing geographies
Don’t present a global TAM and a local SAM without explaining the transition. Always be explicit about scope.
3) Over-segmentation
Detail is good, but unnecessary complexity obscures the message. Segment where it matters strategically.
4) Ignoring competitors
SOM that assumes no competition or effortless capture is rarely credible.
How to design a strong market sizing slide
A good market sizing slide does three things:
Shows scale
Shows focus
Shows realism
Best practices include:
clear labels and assumptions
consistent units (revenue vs users)
simple visuals (circles or bars)
short explanatory footnotes
Where to find market sizing data
Market sizing usually requires triangulation. No single source is sufficient.
Useful inputs include:
Public research and reports
Industry publications, analyst reports, and market research platforms provide baseline figures and growth trends.
Company filings and financials
Public company reports help reverse-engineer market size and competitive share.
Customer and expert interviews
Conversations with buyers, operators, and industry experts often surface segmentation insights that reports miss.
Internal data
Sales pipelines, conversion rates, and deal sizes are often the most valuable inputs for bottom-up sizing.
Documenting assumptions and sources matters as much as the final number.
Examples of effective market sizing slides
Strong market sizing slides often:
connect the market to a strategic narrative
highlight growth or structural shifts
link SOM to execution milestones
The best ones don’t just answer “how big is the market?” but “why this market, and why now?”
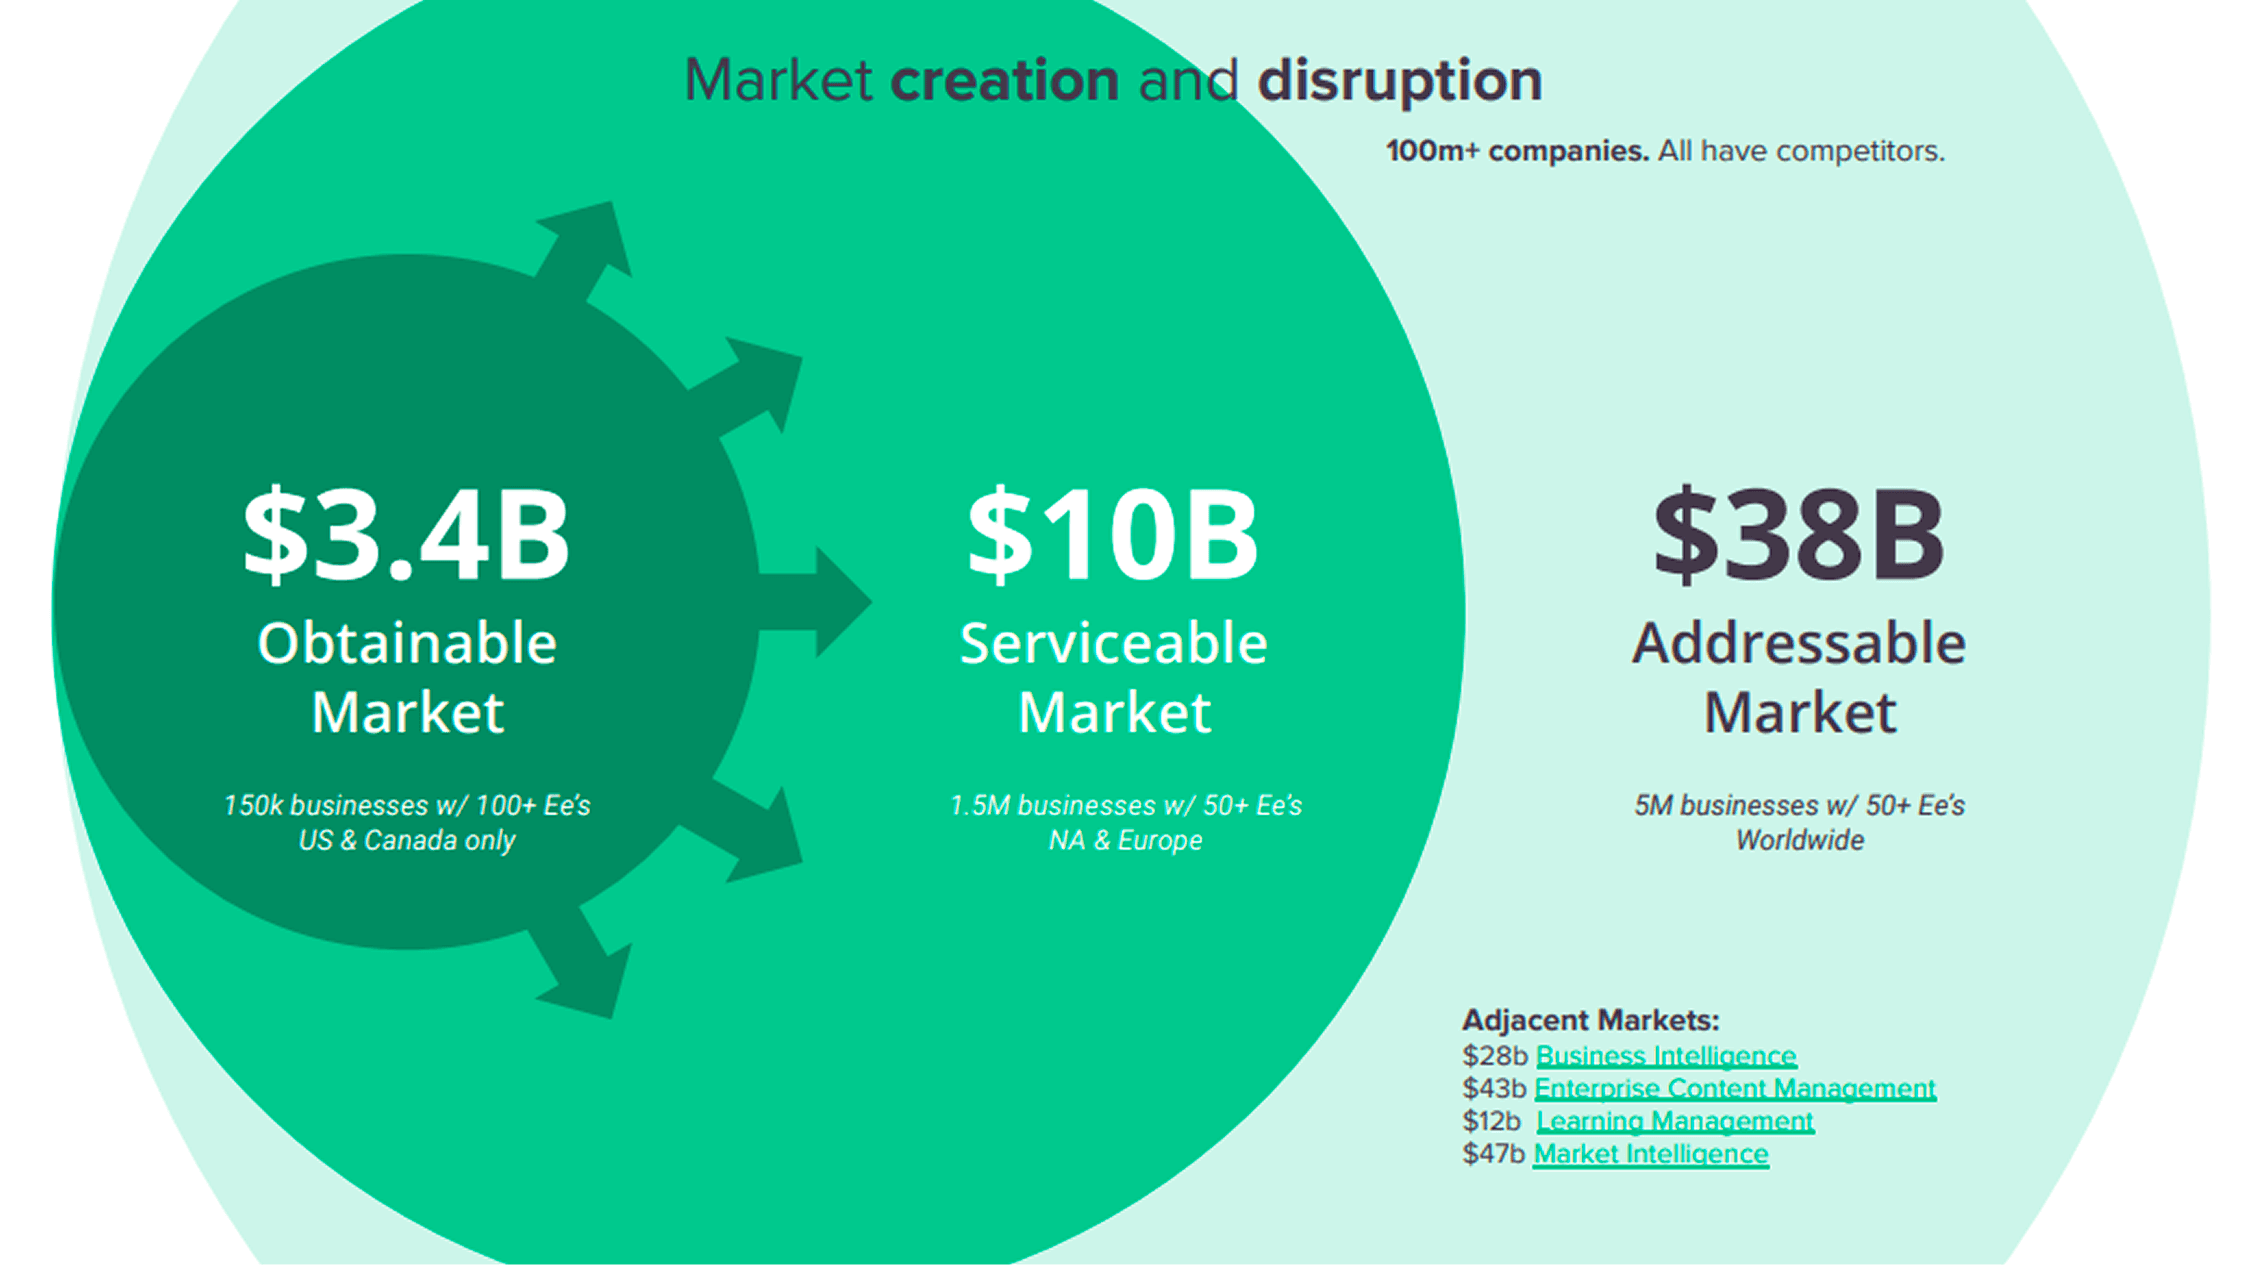
KLUE
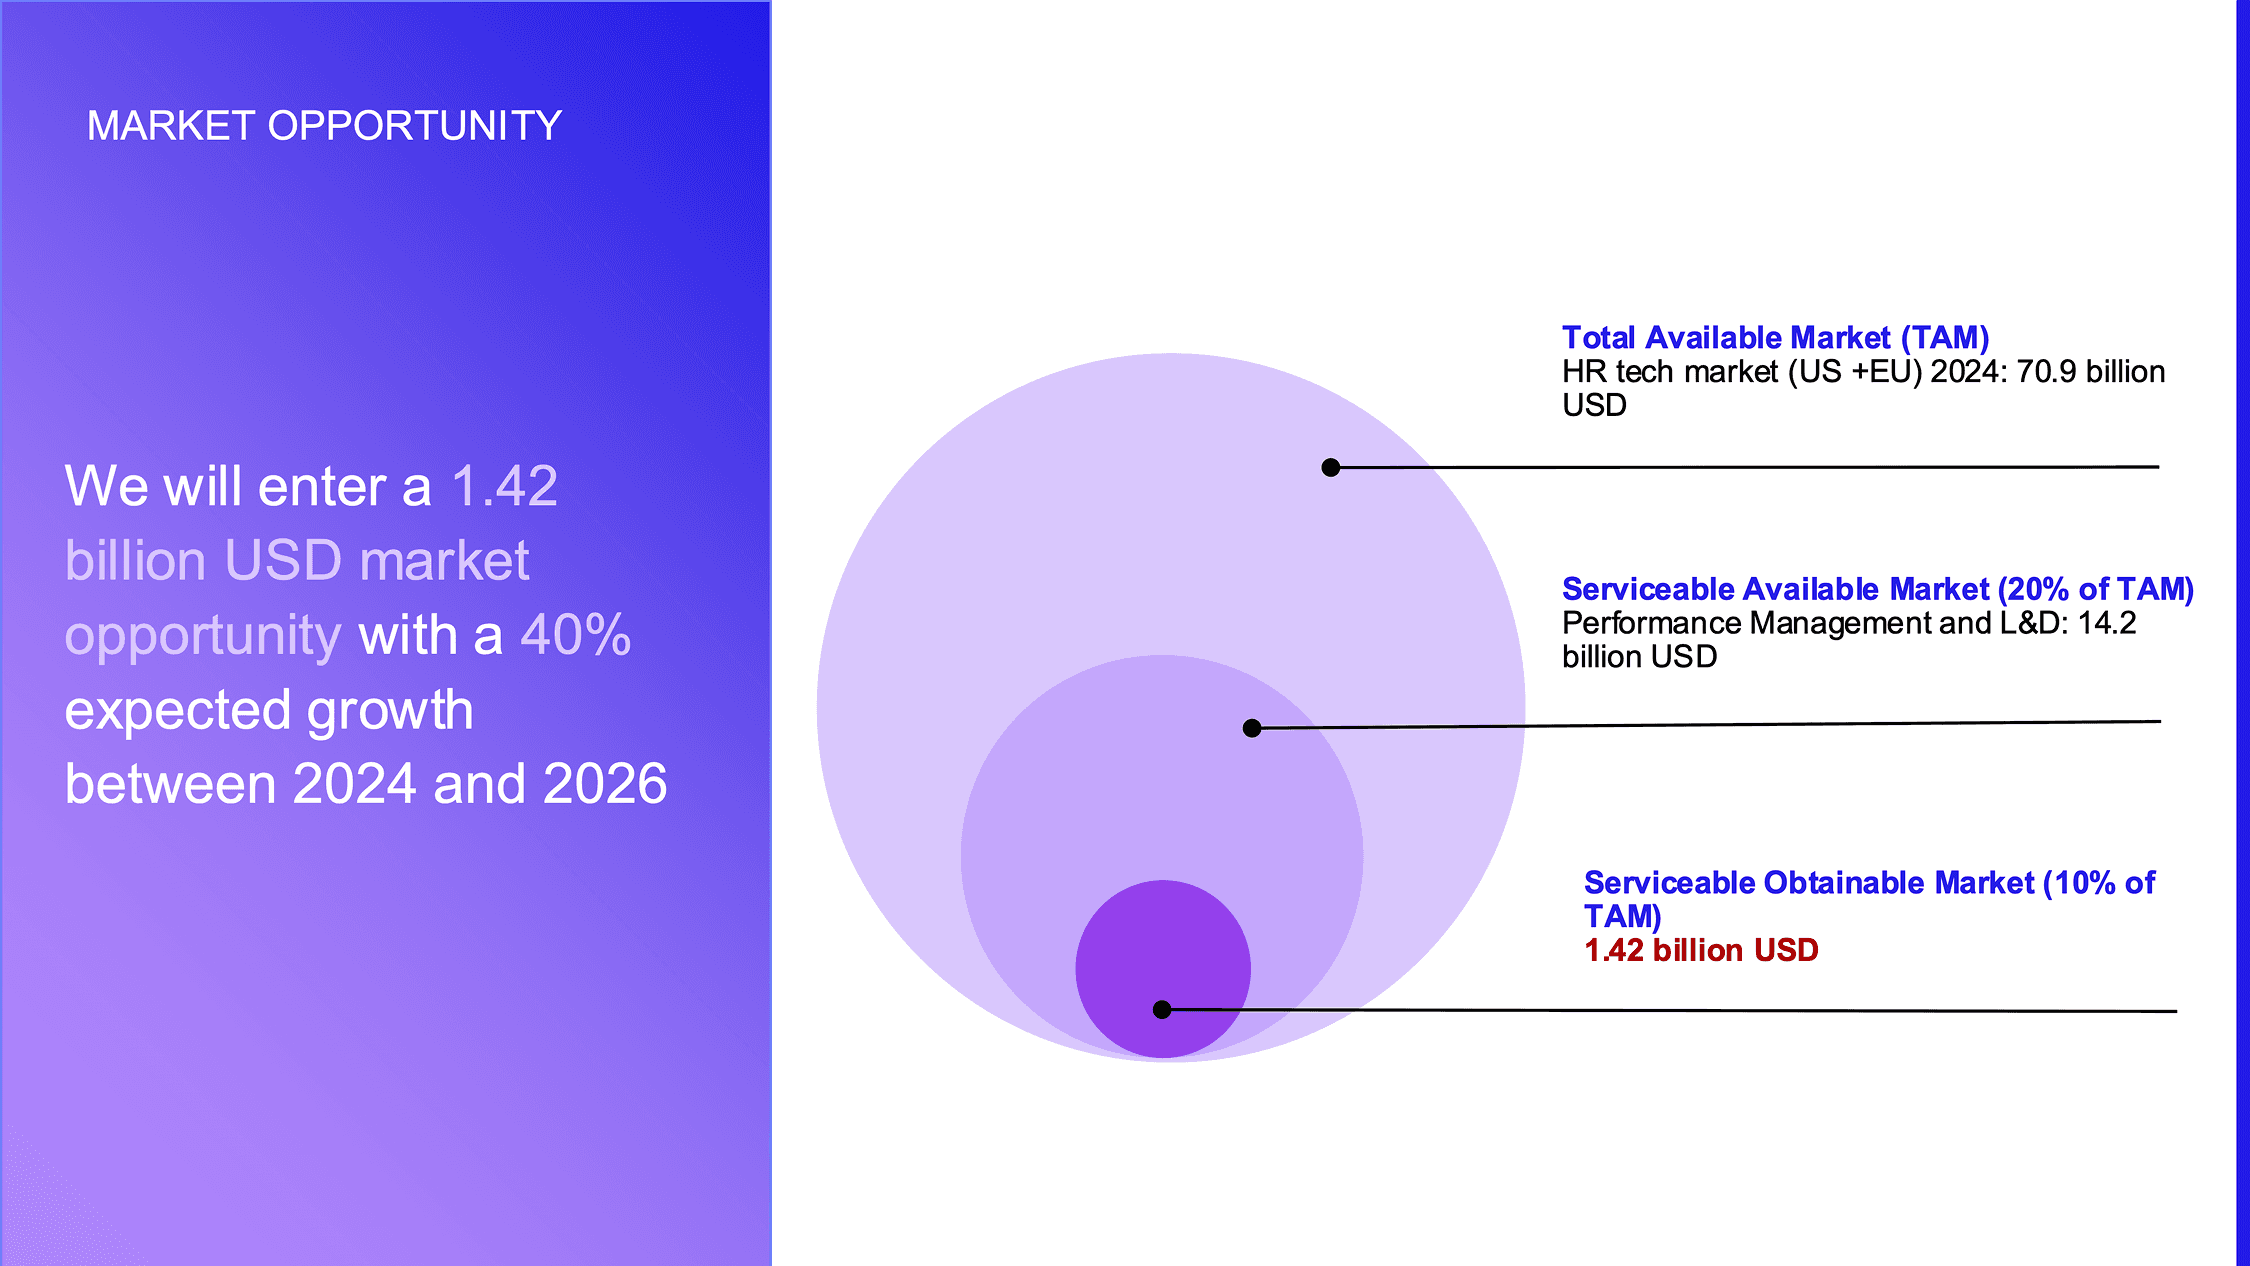
Meldway
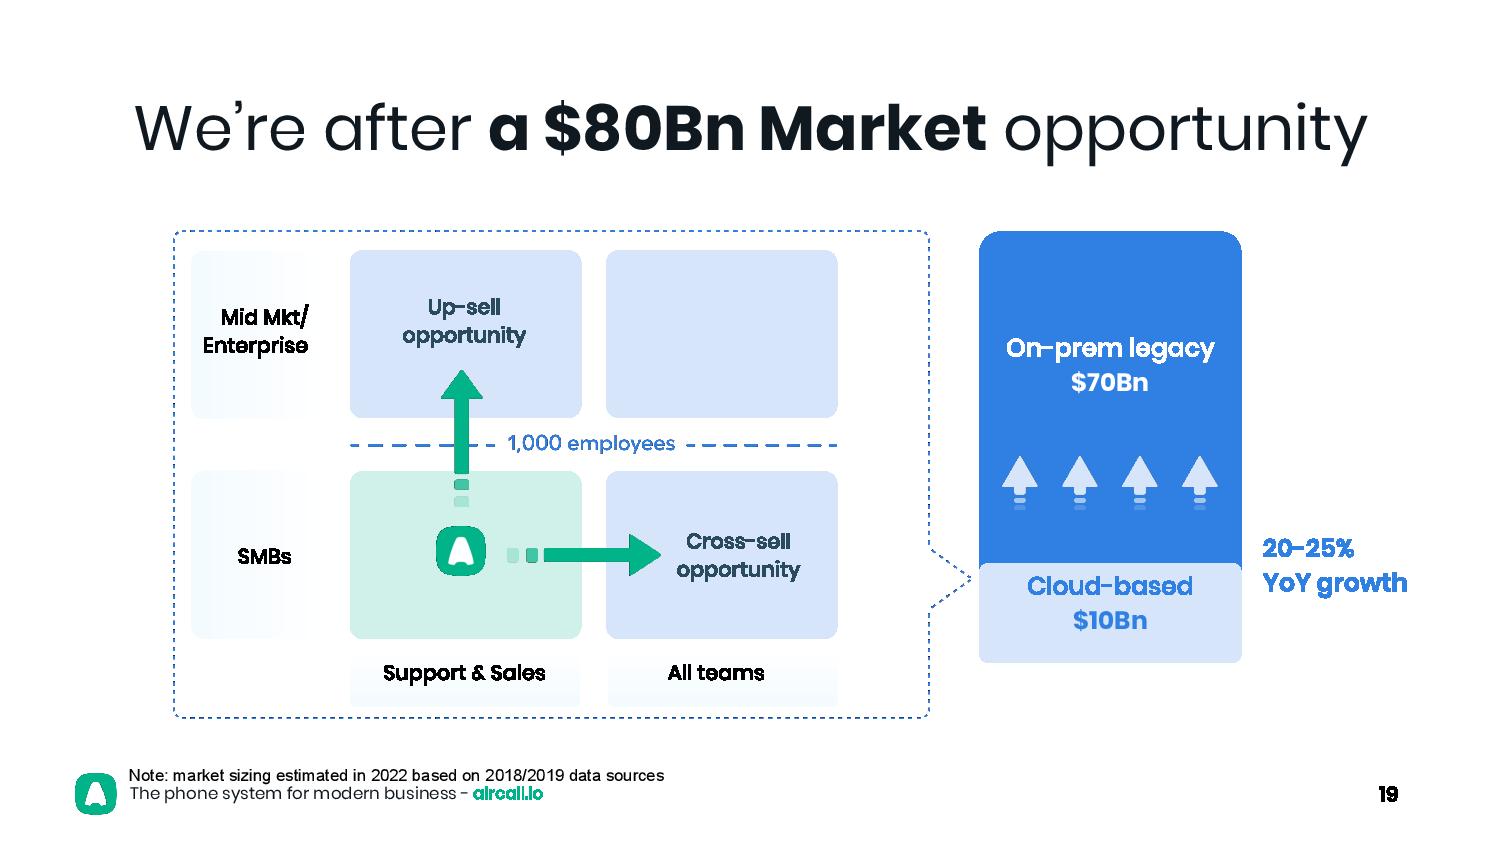
Aircall
Final thoughts
Market sizing is not about finding the perfect number. It’s about showing that you understand the market well enough to make informed bets.
A clear TAM shows opportunity.
A focused SAM shows strategy.
A realistic SOM shows execution discipline.
When those three tell a consistent story, your market sizing slide becomes a credibility asset instead of a liability.


